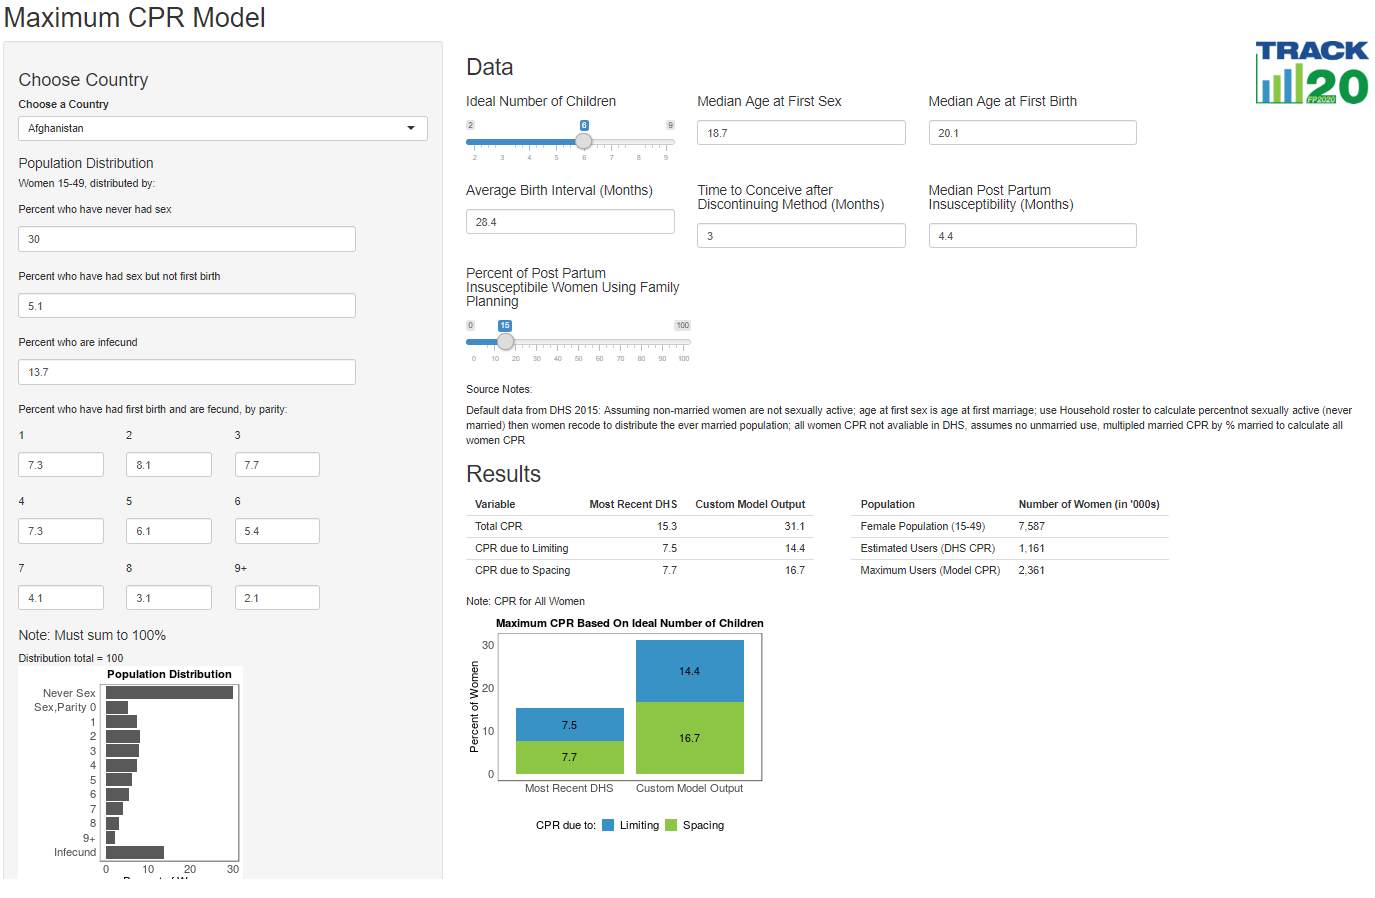
The Maximum CPR Model allows policy makers, family planning advocates, and individuals to determine a country's highest potential contraceptive prevalence rate (CPR), both in terms of use for spacing and for limiting, based on an ideal number of children and key demographic life events. Understanding the highest potential level of CPR achievable under current circumstances in a population leads to realistic expectations and appropriate policy implementation.

Access the Maximum CPR Model Here
Accéder au Modele de TPC Maximum en Français Ici
Ideal Number of Children: By changing the ideal number of children, you change how much of a woman's reproductive life she will spend on childbearing, how much contraception she would need for spacing, and how much she would need for limiting.
Percent of Postpartum Insusceptible Women Using family Planning: Changing this number will change the use of family planning for spacing (and to a lesser extent, for limiting). Shifting the percent using PPFP allows users to see the impact of either no, some, or a large postpartum family planning program on the overall population's CPR.
Age at First Sex and First Birth: If a policy goal is to delay the age at first birth, users may want to see impact of increasing the period between first sex and first birth. If the period becomes significantly larger, users may want to adjust the distribution of women in the left-hand side gray panel to have a larger share of their population sexually active, but unmarried (note: the numbers in the left-hand side gray panel must sum to 100)
Average Birth Interval: Many health programs stress the importance of appropriately spaced births. CPR, especially for spacing, will increase as birth intervals increase.
To learn more about the underlying assumptions and equations of the Maximum CPR Model, please read our peer-reviewed article published on Gates Open Research.
Default data that appears in the Maximum CPR Model comes from the Demographic and Health Surveys, many indicators used in this model are available through StatCompiler and the DHS API, both run by the DHS.
Indicators from StatCompiler include:
- Ideal Number of Children, All Women (Rounded)
- Median Age at First Sex (25-49)
- Median Age at First Birth (25-49)
- Median Birth Interval (Months)
- Median Duration of Postpartum Insusceptible
The remaining indicators are calculated from DHS microdata. Code for calculating input data in Stata and R are available on the Track20 Github. In this repository, users can also find the code to pull data from the DHS API and create the Shiny app which houses the MaxCPR model.