Many countries struggle to achieve the right balance of investments between expanding family planning services and undertaking social and behavior change (SBC) activities. If countries allocate too few resources to SBC, then investments to improve family planning services may fall short of their potential impact. If there is not enough support for expanded services, then countries may not be able to meet demand. Understanding this balance is important to help identify opportunities and limitations and prioritize resources to ensure effective family planning programs.
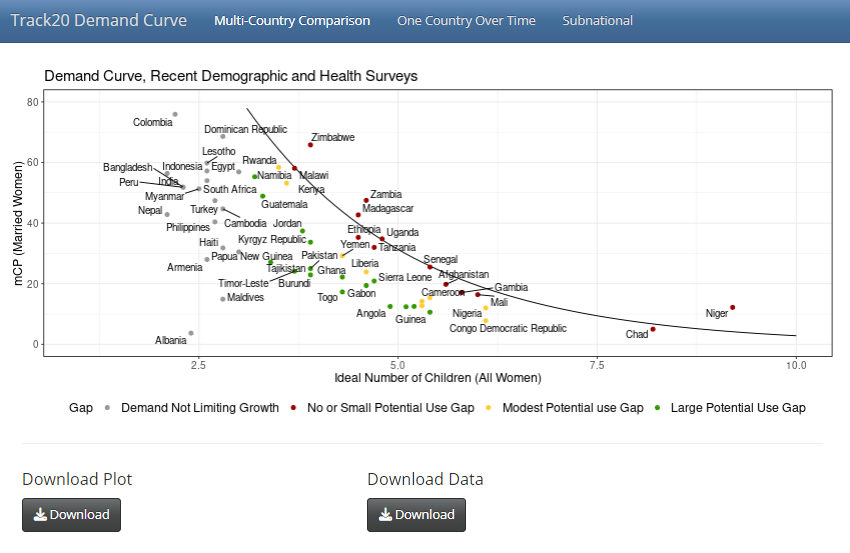
The Track20 Demand Curve represents the likely maximum mCPR that could be reached in a country given their level of demand. The curve was created by fitting an exponential curve to the maximum of all available DHS survey data on mCPR and ideal number of children, an indicator that represents a broad range of social and cultural norms that influence the motivation to use, or not use, contraception.
For more information about the methodology, see our publication The maximum contraceptive prevalence 'demand curve': guiding discussions on programmatic investments.
Track20's interactive demand curve app has multi-country comparisons, trends over time, and subnational analysis.

Access the Track20 Demand Curve Here
The app contains the most recent Demographic and Health Survey data for all countries with a survey after 2012. Choose as many or as few countries as you would like to compare. Countries closer to the line have an mCPR close to the maximum mCPR for their ideal number of children and have limited opportunities to increase contraceptive use without changes in ideal number of children. Countries farther away from the curve have more room for growth in mCPR without changes in ideal number of children. You can download the graphic and data input by clicking on the download buttons.
Note: The demand curve is most useful for populations with an ideal number of children over 3.
On this tab, you can choose one country and look at how mCPR and ideal number have changed over time and how the country has moved closer to or farther from the Demand Curve. You can download the graphic and data input by clicking on the download buttons.
On this tab, you can choose one country and look at how mCPR and ideal number vary by region. Within the same country, there can be large variation in how close regions are to the demand curve and understanding these differences is important for subnational family planning programming.